The Half-Empty Cup
CUSD admin has used a half-empty cup graphic to share a message about our financial resources. What is that message?
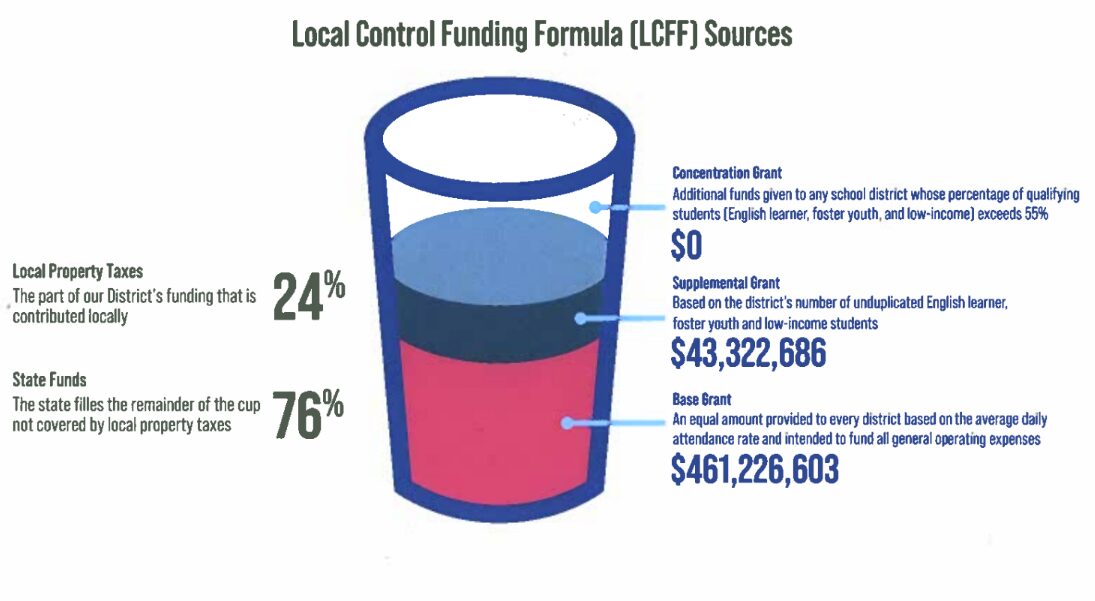
At every Spring Update, the district shares a graphic of a half-empty cup that shows what funding the district gets from the state and the empty portion that represents what other districts get that Clovis Unified doesn’t. ACE brought to the district’s attention that this oft-used graphic is misleading to most folks who look at it. The cup, in reality, is mostly full.
The cup graphic seems to show a significant shortfall of what appears to be over 1/3rd of the cup. It also seems to present the portion that comes from the “Supplemental Grant” as a far larger portion than what the numbers would indicate.
At ACE, we want to make sure that we’re getting the information accurately. Certainly we all believe that we should be investing as much as we can in our students, but what is Admin implying about the state funding, and what is the reality?
This chart presents a “half-empty glass” perspective on Clovis Unified funding, implying visually that the Supplemental and Concentration Grant funding could provide half of the district’s revenue if it were maximized in Clovis. In fact, Clovis Unified receives the same base grant amount per student (ADA) as the rest of the state, and other districts with high levels of low income, English language learners, and foster children receive more in the Supplemental and Concentration Grant to support their higher-need student body.
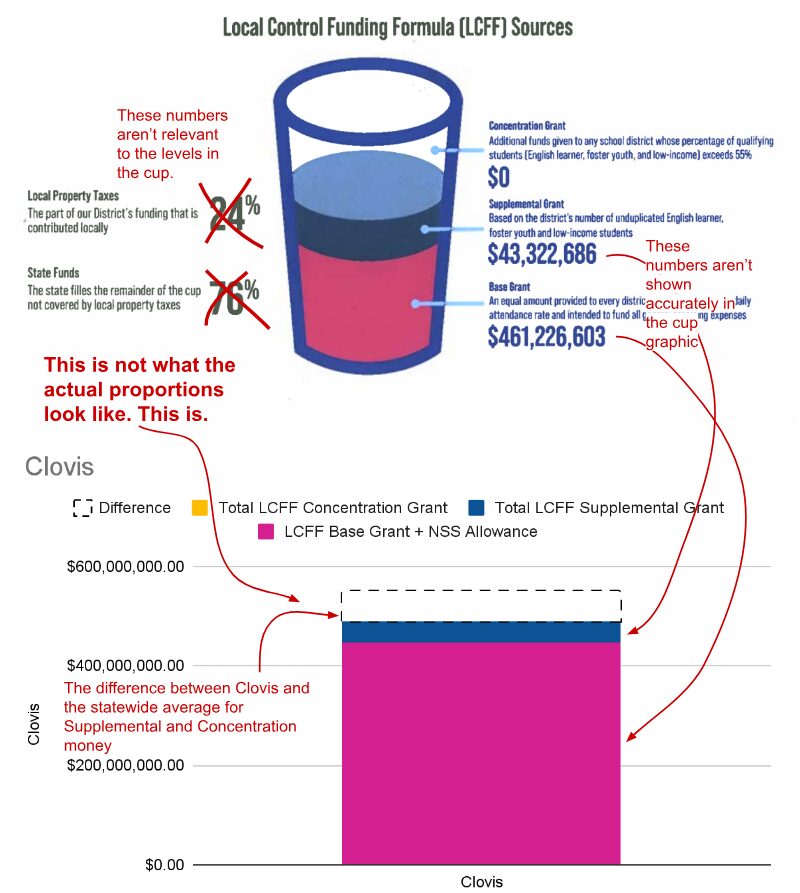
Clovis receives some of the Supplemental Grant but none of the Concentration Grant. The cup also includes confusing information on the left side of the cup, which does not correlate to the levels in the graphic. It isn’t incorrect, it’s just placed in a way that is easily misunderstood. You can do the math for yourself and see that the Supplemental Grant is less than 10% of the total, not 25%.
At ACE, we want to make sure that we’re getting the information accurately. Certainly we all believe that we should be investing as much as we can in our students, but what is Admin implying about the state funding, and what is the reality?
The cup also includes confusing information on the left side of the cup, which does not correlate to the levels in the graphic. It isn’t incorrect, it’s just placed in a way that is easily misunderstood. You can do the math for yourself and see that the Supplemental Grant is less than 10% of the total, not 25%. In fact, the base grant, makes up about 91% of Clovis Unified’s LCFF funding sources. In an average school district, the Baseline grant funding makes up about 81% of their LCFF funding. A more accurate graph would look like this:
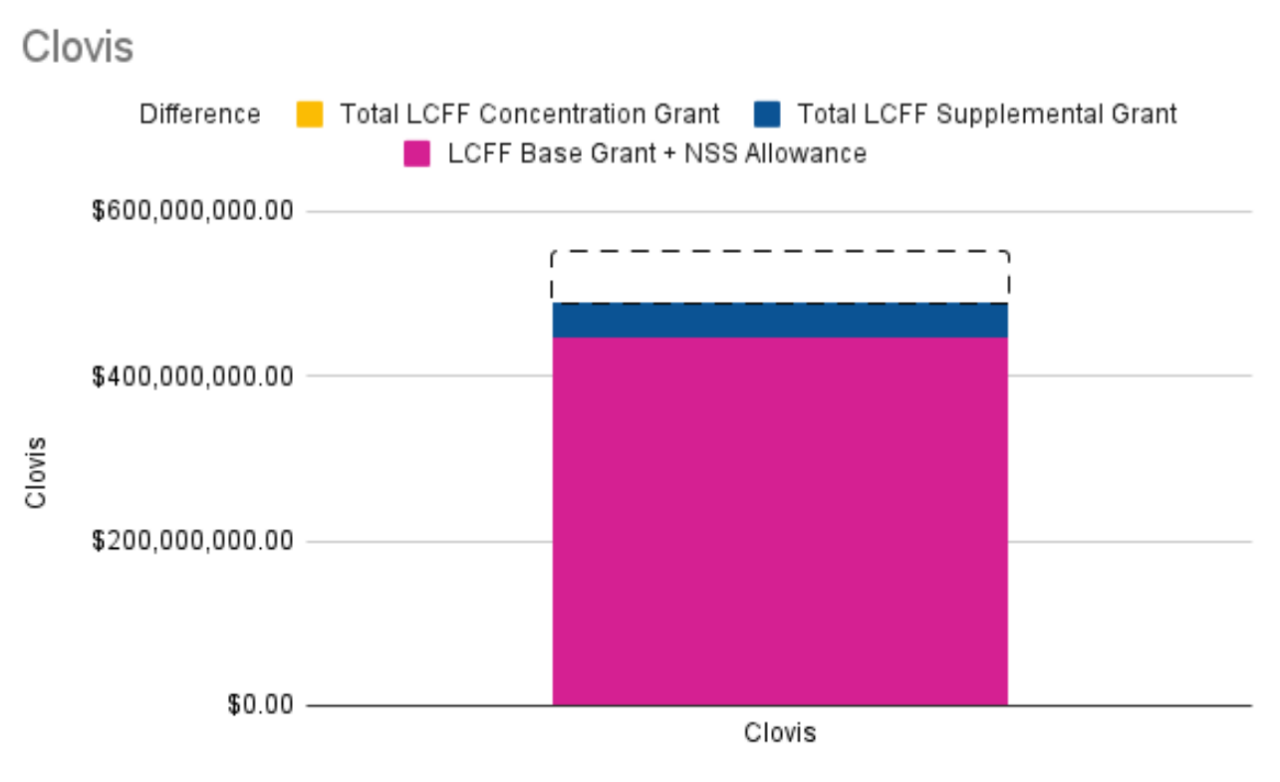
This chart shows that the glass is actually mostly full compared to the statewide average. It is true that we have less-than-average funding through the LCFF calculations, but certainly not to the degree that you might take away from the cup graphic. The second concern is that when the district floats the hypothetical that this funding could be increased for Clovis, they’re implying that funding should be taken away from districts that currently get concentration dollars due to their higher levels of students in low-income households, English language learners, and foster students. Multiple studies have shown that this model of funding is helping to address academic gaps among low-income students.
We took this concern to the Clovis Unified admin and asked them why they’re using this graphic. Their answer was that they stand by their messaging and that they have a duty to advocate for Clovis to receive more funding. We agree with that, but doesn’t respond to our concern that the graphic is misleading.
ACE knows that Clovis is a great school district. We do a lot for our students with the funding we get. We agree with the Clovis Unified district admin that we could do so much more if we had more resources, but we don’t think it should come at cost to students who need the most help. It should be increased for all students. California is now slightly above the national average for spending on K12 funding, but is still only 18th out of 50 states and DC.
That’s why we’ve partnered with CTA, who are constantly fighting for the resources our students need. That fight has directly benefited our district even didn’t know. One example is Prop 55, which increased the funding for K-12 schools in California. Prop 55 is up for renewal in 2026 and Clovis could lose over $60 million in 2030 if it isn’t renewed. CTA is already gearing up to make sure we don’t lose that funding.